miRNAtools3 > Tutorials > Multiple miRNAs scenario
Scenario 2: Multiple miRNAs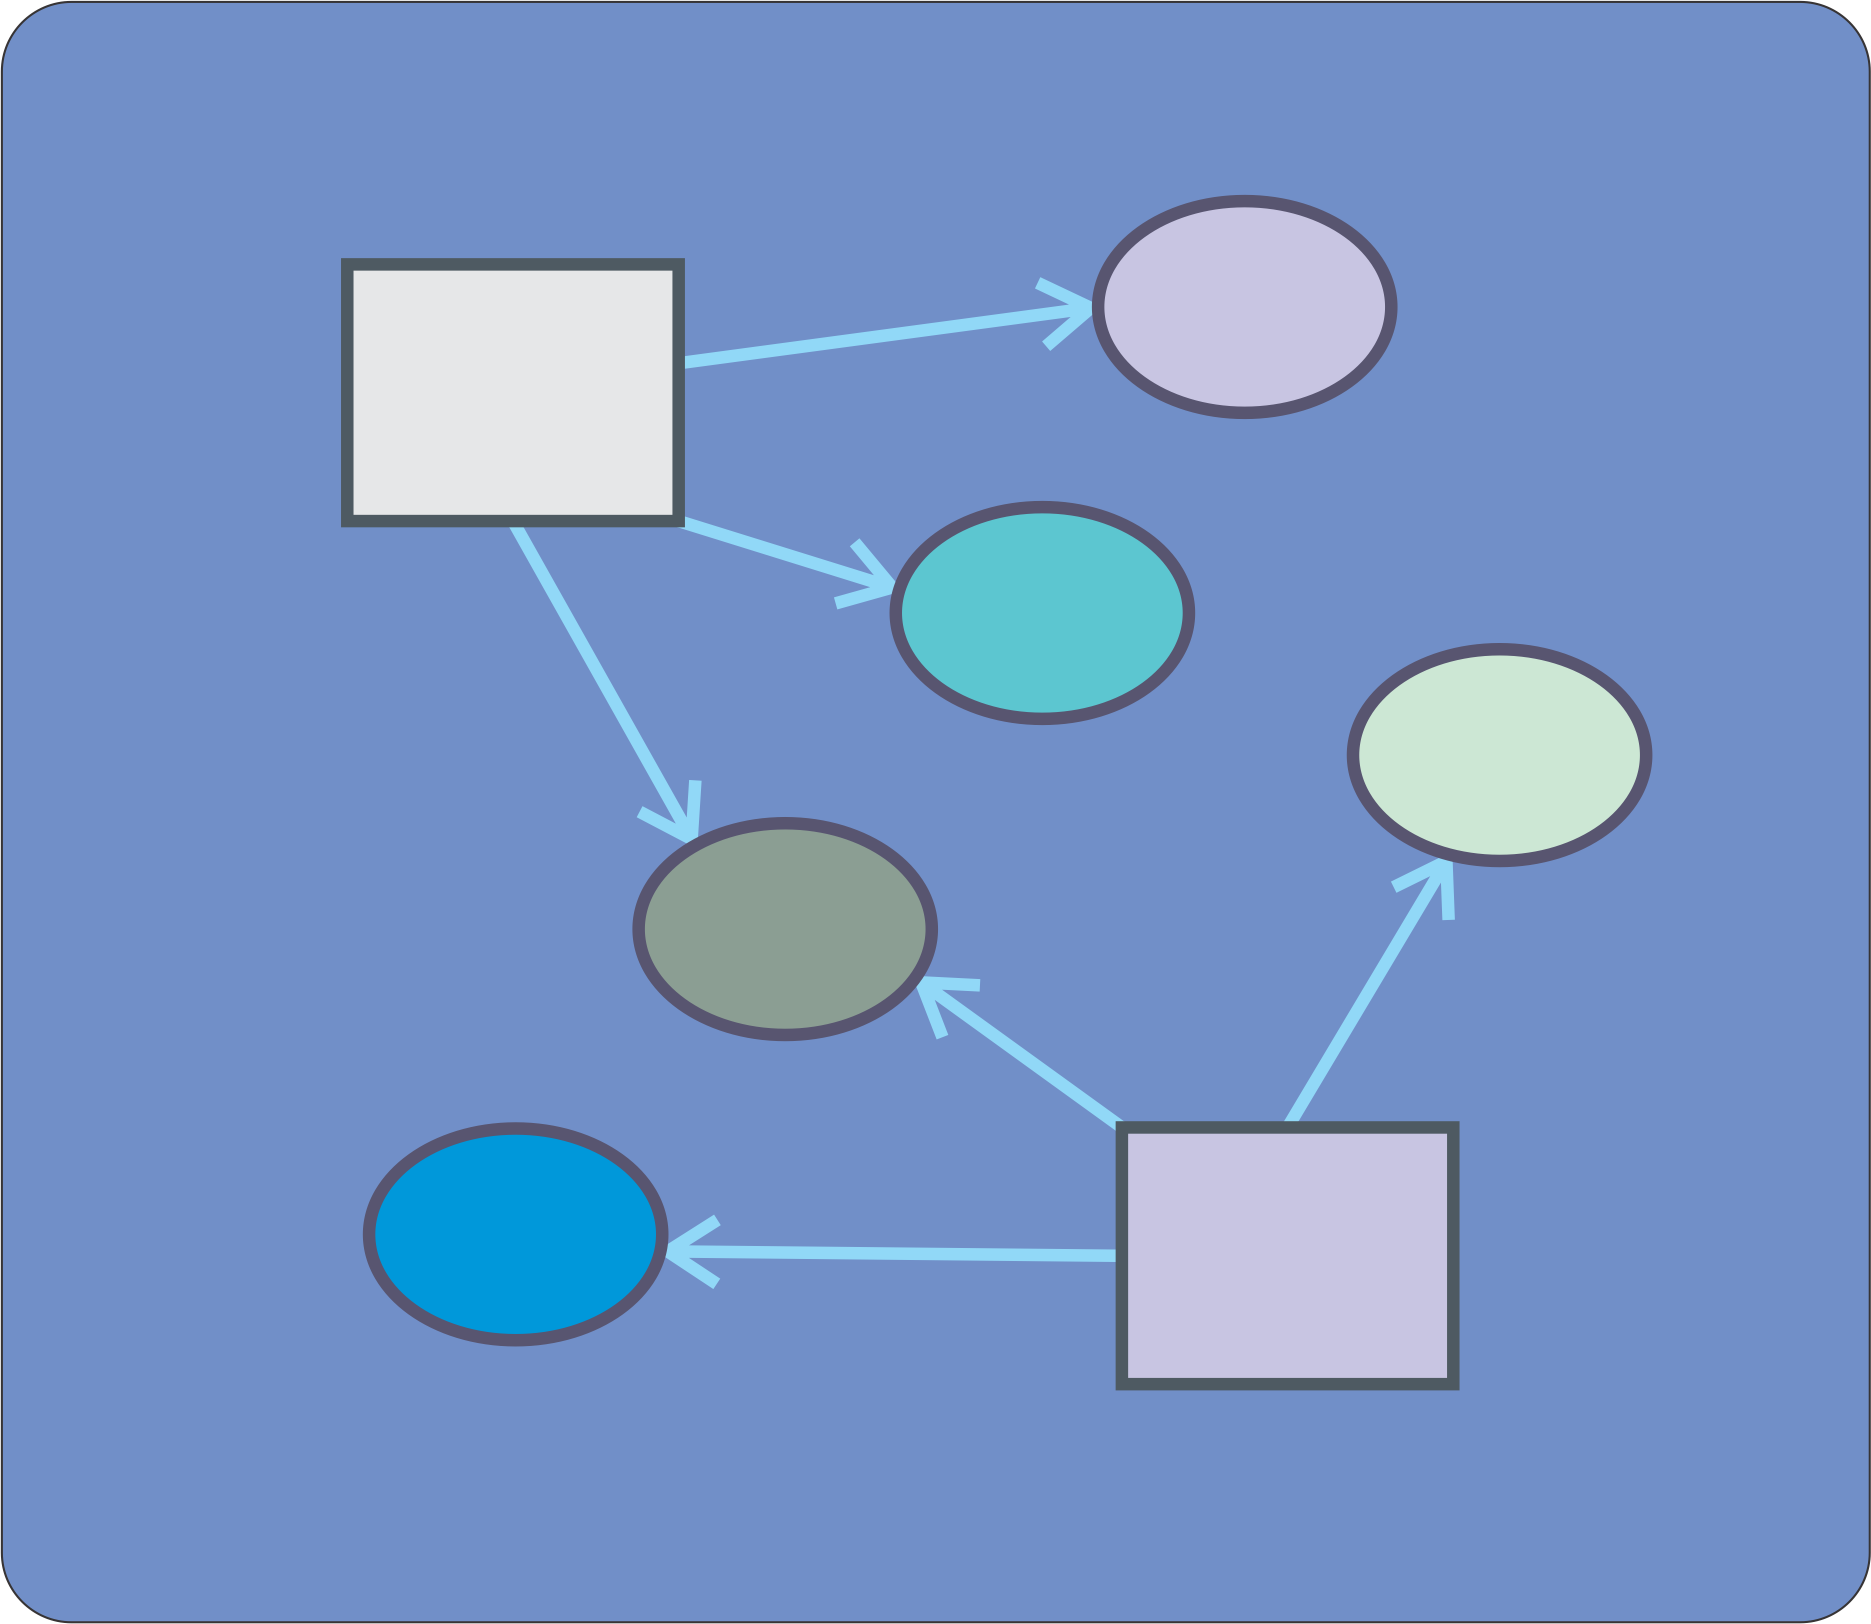
![]()
1.- INTRODUCTION: miR-17-92a cluster
In humans and other mammals there is a cluster of miRNAs located in chromosome 13, named as 17-92a, which includes six miRNA genes expressed in tandem from the same promoter (hsa-miR-17-5p, hsa-miR-18a-5p, hsa-miR-19a-3p, hsa-miR-20a-5p, hsa-miR-19b-3p and hsa-miR-92a-3p). This cluster has been implicated in cell proliferation in processes ranging from cancer to organ development. A recent paper by Chen and coworkers showed the proliferative action of this miRNA cluster over cardiomyocytes, but the cluster was initially characterized as overexpressed in many kinds of tumors. Eukaryotic cells have the tendency of being redundant in many of their metabolic processes, and for this reason a coordinated action of the miRNAs belonging to the 17-92a cluster is expected. This tutorial will try to analyze the possible combinatorial action of the six members of the 17-92a cluster over gene transcripts in human cells.
2.- Predicted Targets for miR-17-92a cluster
Using multiple predictors, it would be easy to retrieve a list of putative targets for the members of 17-92a cluster, as we described in Scenario1. However once we get the list of targets the main question is what to do next?. What are the most relevant miRNAs for my particular process?. What are the most interesting targets or miRNAs to study in a wet-lab basis?.
To answer to this questions the best way is to integrate all the predicted target information in a graphical manner. For this purpose it is easy to construct a network of miRNA-mRNA interactions by using specially devoted software such as NAVIGATOR or CYTOSCAPE. Just download the table with the predicted targets, import into the network software and define miRNAs and targets as NODES. The software will connect them according to the relationships extracted from the target prediction software.
In order to pinpoint the most important relationship use the network software to filter the nodes and select the ones that have the biggest number of connections as it is depicted in the next figure:
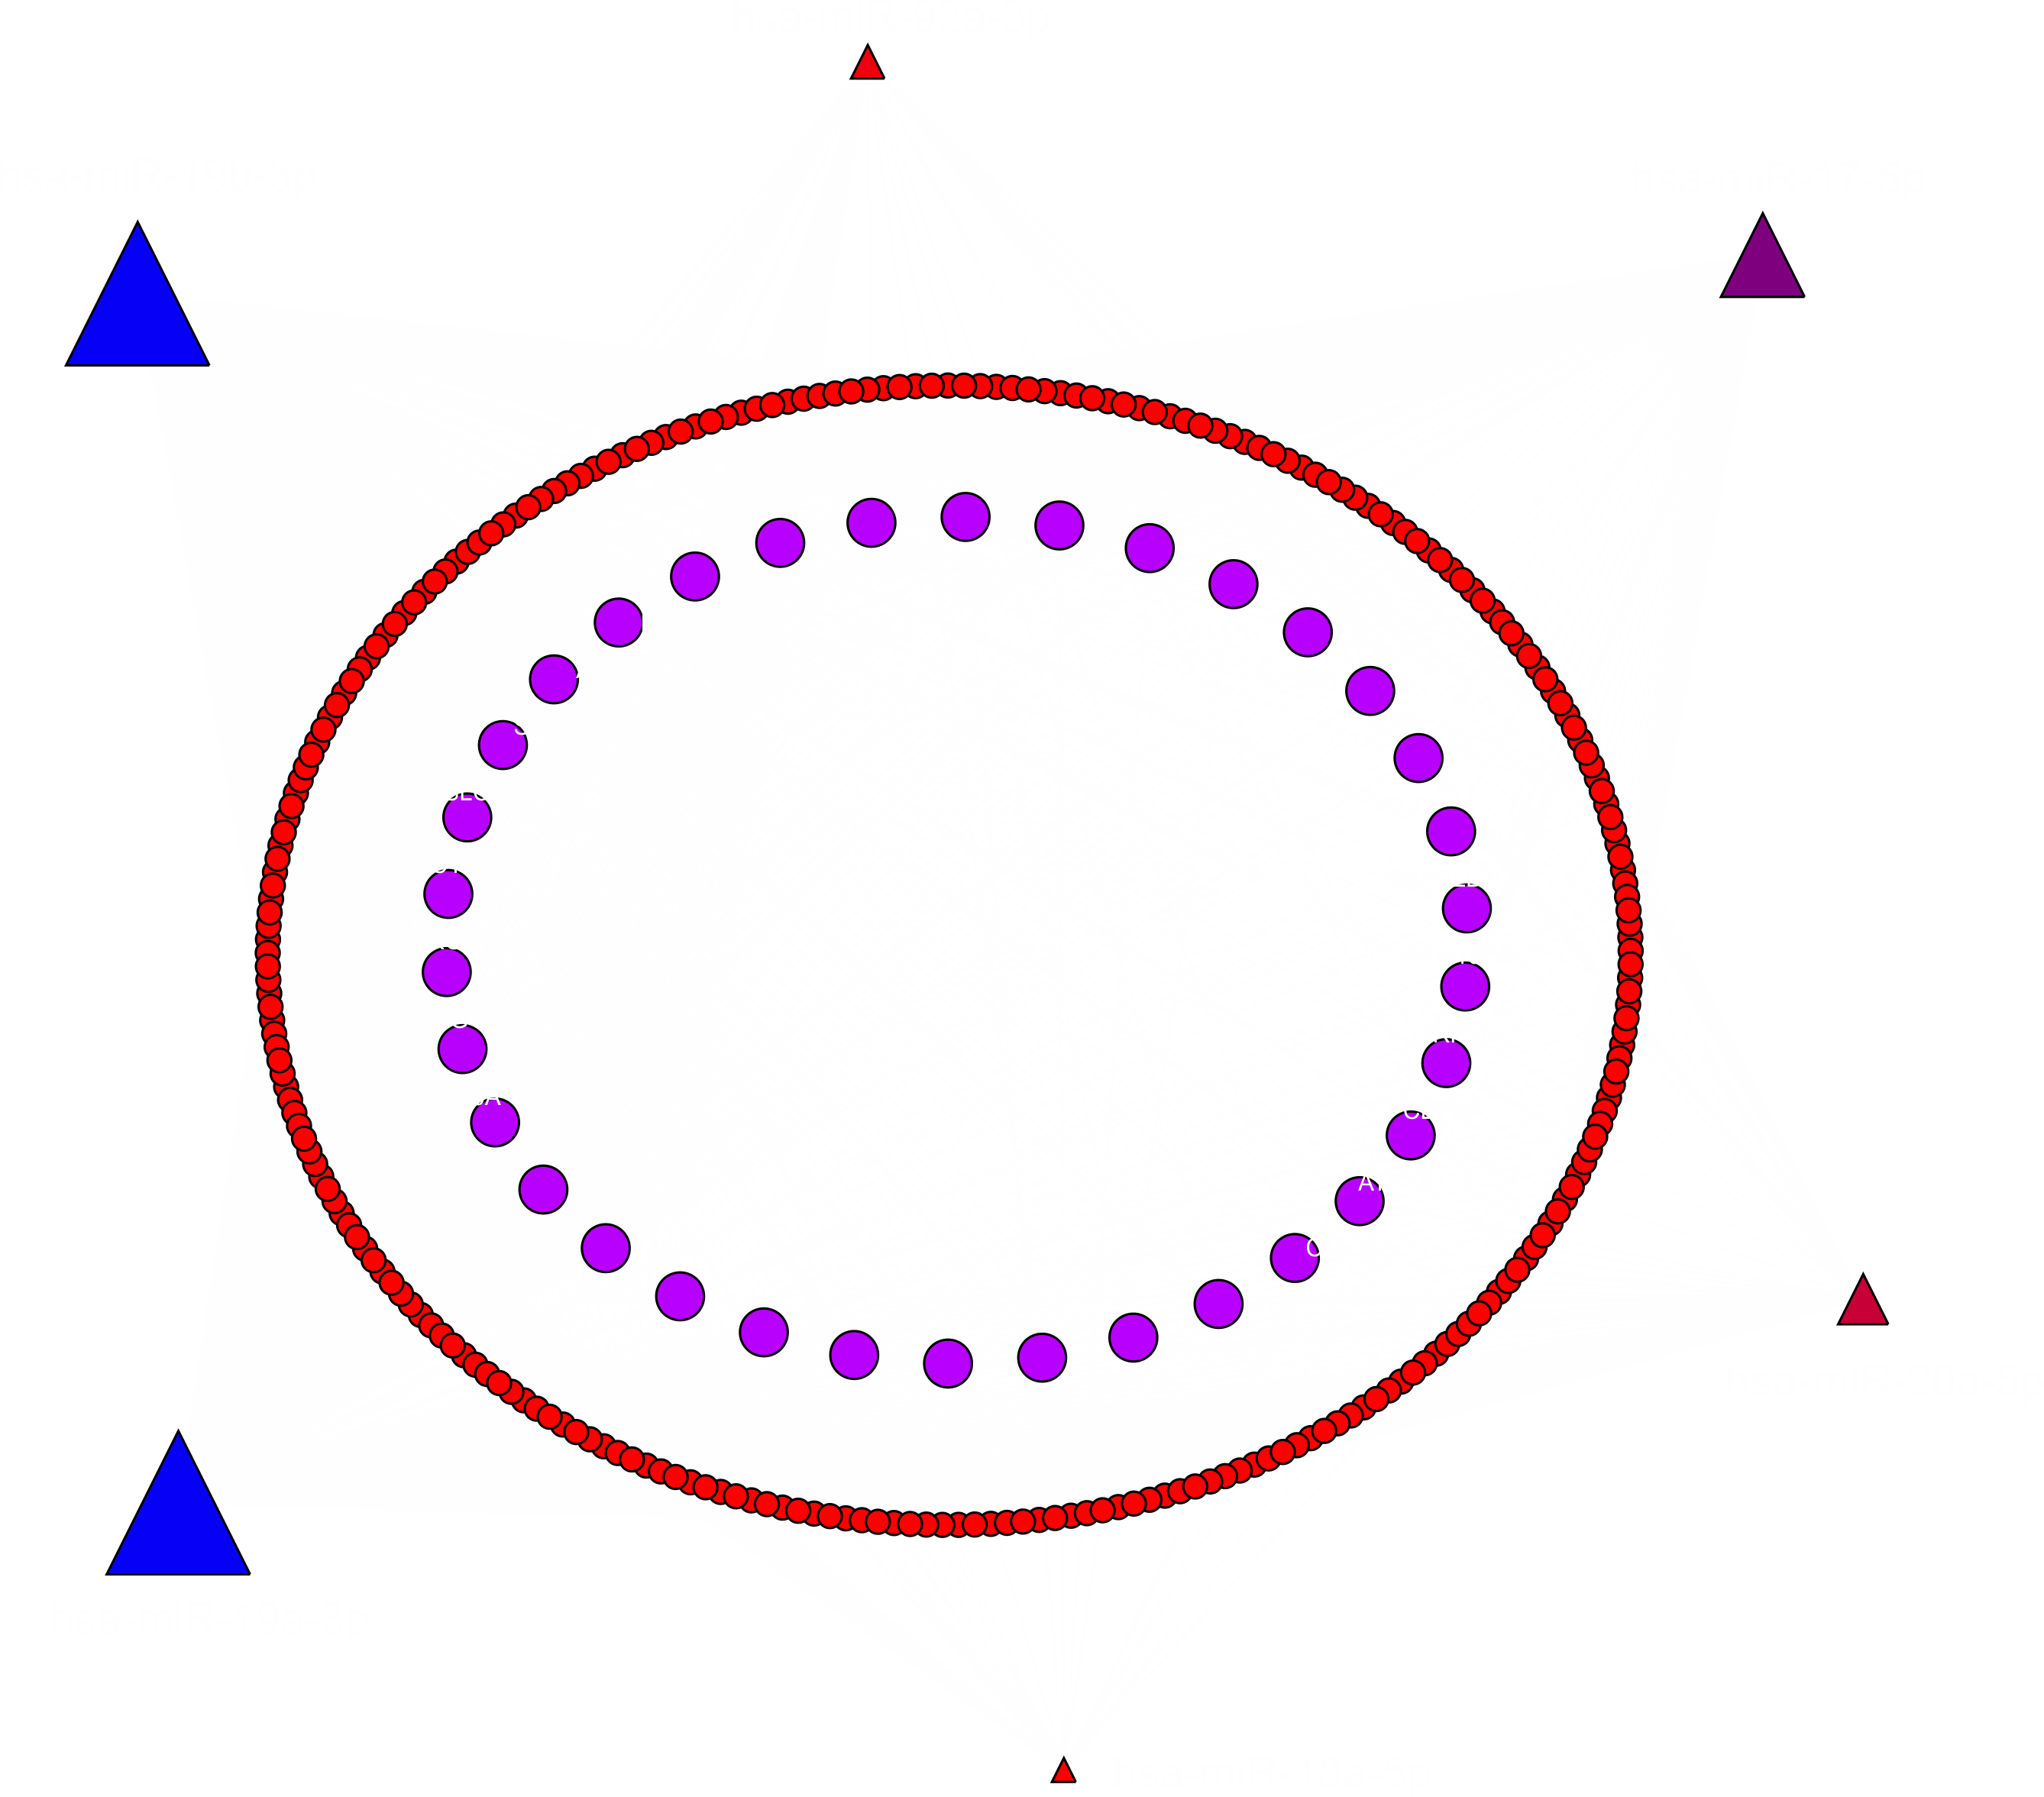 |
| Simultaneous analysis of predicted targets from the 17-92a cluster members. Targets have been filtered selecting the ones with the biggest number of connections. The red dots represent mRNAs being targeted by 3 miRNAs and the magenta dots are the genes targeted by 4 of the 17-92a cluster members. The symbols of the miRNAs have been represented with sizes proportional to the number of targets that they have. So, you can get information about what are the most relevant miRNAs and also what could be the most interesting targets to be studied. |
3.- Integrative analysis of validated targets for miR-17-92a cluster
Fortunately for the most lazy users, there are some solutions that will help to construct integrative interaction networks directly on the web. In this particular case we will use the miRNet application to construct a miRNA-mRNA interaction network. miRNet is an amazing application with a hightly intuitive graphical interface, but only works with validated targets either by experimental methods or by text mining. This application allows many kinds of input ranging from gene expression data to a list of genes or miRNAs. You can also interrogate miRNet using epigenetic modifiers, small molecules or diseases.
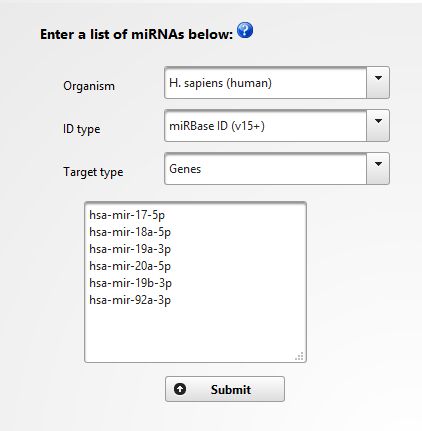
In our case we are interested in constructing an integrated network of validated targets for 17-92a cluster members. So, open miRNet webpage and in the input type select "miRNA". In the following page introduce the identifications of 17-92a cluster members and select the organism, ID type and target type as following, click "SUBMIT" and "PROCEED":
 |
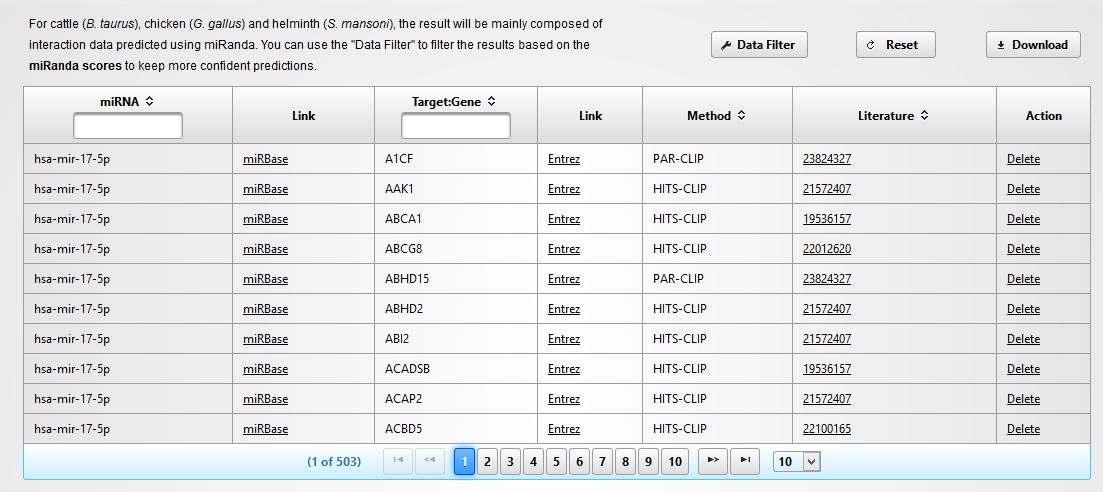
In the next screen you will get a tabular view of the results, including the information about the miRNA and its targets, the experimental method used for validation and the Pubmed reference (See below). You can download the table and import into Excel if you wish. Click in "PROCEED" to continue.
 |
You will see now a new screen that will inform you about the data regarding the network to be constructed. In our case we have 6 miRNAs (queries) with a total of 2985 targets (See below).
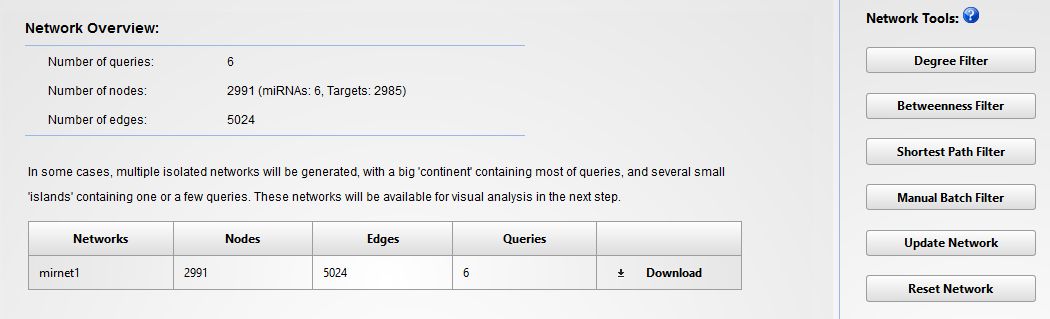 |
This is a pretty big network, which would be impossible to analyze. So, to filter it and reduce the number of nodes, the best way is to use the "Degree filter" button. This tool will allow us to select the nodes that have a minimum number of connections. In this case we will apply a degree cutoff of "4" for all the network nodes. This means that only those nodes connected by 4 or more edges will be considered. When the filter is applied, the network is reduced to 44 targets. After the filtering click in "PROCEED" to construct the graphical representation. You will get something like that:
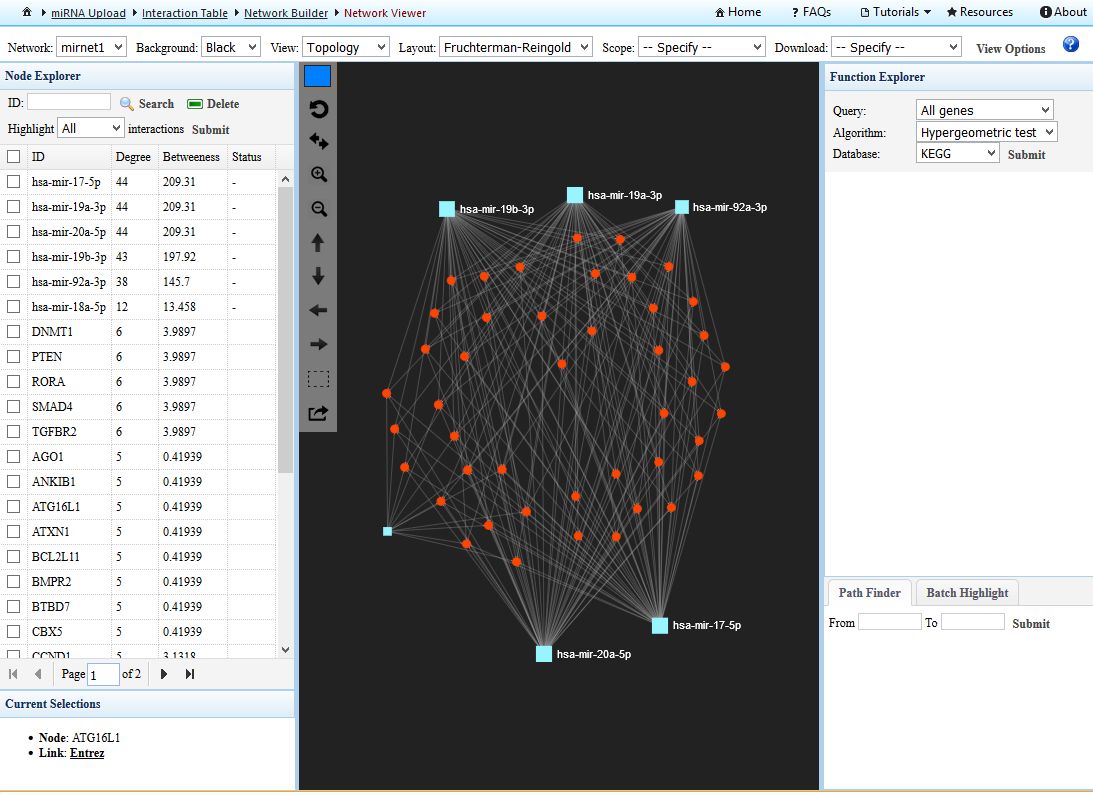 |
| miRNet screenshot of out interaction network. MiRNAs are depicted as squares and targets as circles. The user can interact very easily with the application. In the left panel we can select and highlight any of the components of the network (look that there is a column indicating the "degree" of interaction of any network component). In the middle pannel we can drag and drop any element to improve the design of our network. The right panel is probably even more useful, since we can perform gene enrichment analysis of the whole network, in order to find groups of genes associated by particular biological functions or pathways. Now is your time to play around ! |
-
© Francisco J. Enguita. 2010-2017. All rights reserved.