miRNAtools3 > Tutorials > Expression analysis
Scenario 5: 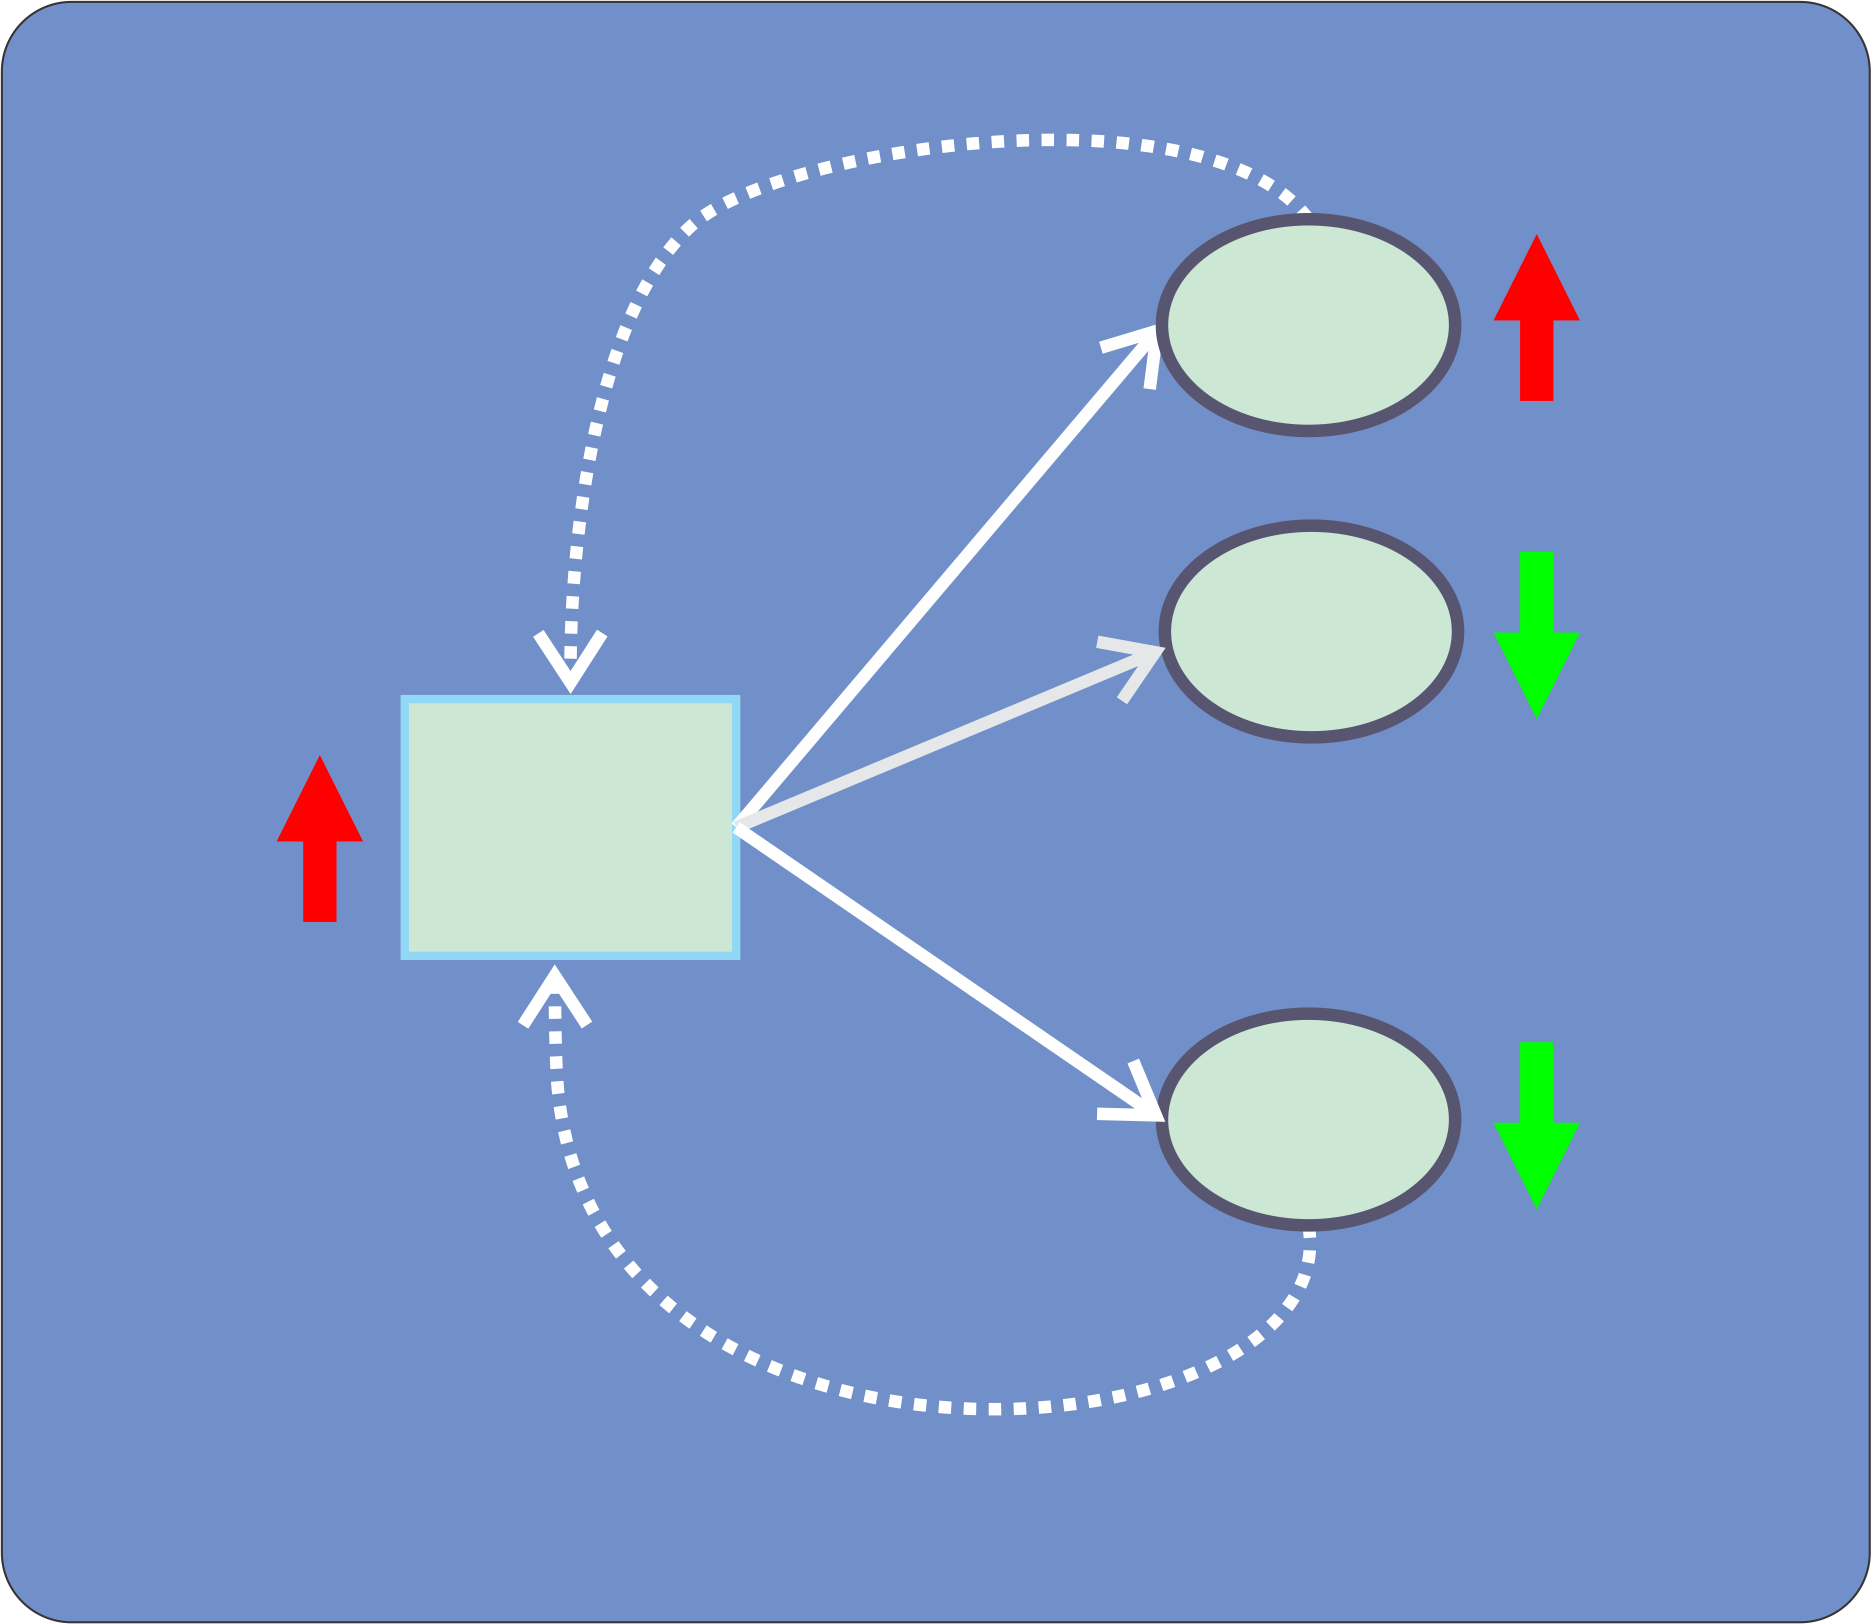 miRNA-mRNA expression correlation analysis
![]()
1.- INTRODUCTION
The biological action of a particular miRNA depends on the simultaneous existance of its cognate mRNA target(s) in the same cellular context. The characterization of the biological roles of miRNAs is often complex since cells are extremely redundant. Frequently, transcriptomic analysis is used as starting point to determine the relevance of action of miRNAs over the cell metabolism. In this tutorial we will explain how to use gene expression data to characterize the putative action of miRNAs, by employing a correlation analysis. It is important to point that in a biological context we expect inverse correlation between the expression levels of miRNAs and their cognate targets. This effect should be more relevant for those over-expressed miRNAs, since the increase of mRNA levels could be due to other intrinsic players such as transcription factors.
2.- Introduction to correlation analysis with miRTarVis+
The inverse correlation analysis between miRNAs and their targets could be performed manually, but for this tutorial we will take advantage of a web-based application called miRTarVis+. This application (described in the Integrative analysis section of miRNatools3) performs differential expression analysis of miRNAs and mRNAs, calculates correlation between expression levels of both groups of RNAs, and integrates all the information together with target prediction algorithms. The main advantage of miRTarVis+ is its easy-to-use interface, and the excellent graphical representation of the results.
For the analysis we will use a real dataset obtained by microarray profiling in tumor cells and healthy paired tissue. The dataset contains two files with the expression data:
| 1.- gene_expression_mirtarvis.csv | comma-delimited file containing expression data for gene transcripts in three control and three tumor samples. |
| 2.- miRNA_expression_mirtarvis.csv | comma-delimited file containing expression data for miRNAs in the same samples. |
If you click in one of the file names you will be prompted to open it with a text editor such as Notepad (Windows). The first lines of the "gene_expression_mirtarvis.csv" file will look like that:
gene,1_pre,2_pre,3_pre,1_post,2_post,3_post
A1BG,1113.09,927.20397,1002.89409,710,622.67,646.1
A1BG-AS1,326,271.558,293.726,941,825.257,856.31
A2M,21,17.493,18.921,703.99,617.39923,640.6309
A2M-AS1,137,114.121,123.437,14,12.278,12.74
A2ML1,1967.61,1639.01913,1772.81661,1,0.877,0.91
A4GALT,646,538.118,582.046,599,525.323,545.09
AAAS,7073.28,5892.04224,6373.02528,4798.02,4207.86354,4366.1982
AACS,9226.53,7685.69949,8313.10353,4439.13,3893.11701,4039.6083
First like is a "header", indicating the number and sample names. Please note that miRTarVis+ only understands particular names for headers. So, it is compulsory to name the samples as "_pre" and "_post", starting with a number. In our case "_pre" means "control" and "_post" refers to the tumor samples. The "miRNA_expression_mirtarvis.csv" looks similar to this, but contains expression data for miRNA in each sample. These files can contain microarray or NGS data depending on your experimental design.
Now open miRTarVis+. You will be redirected to the data input screen, seeing something like that:
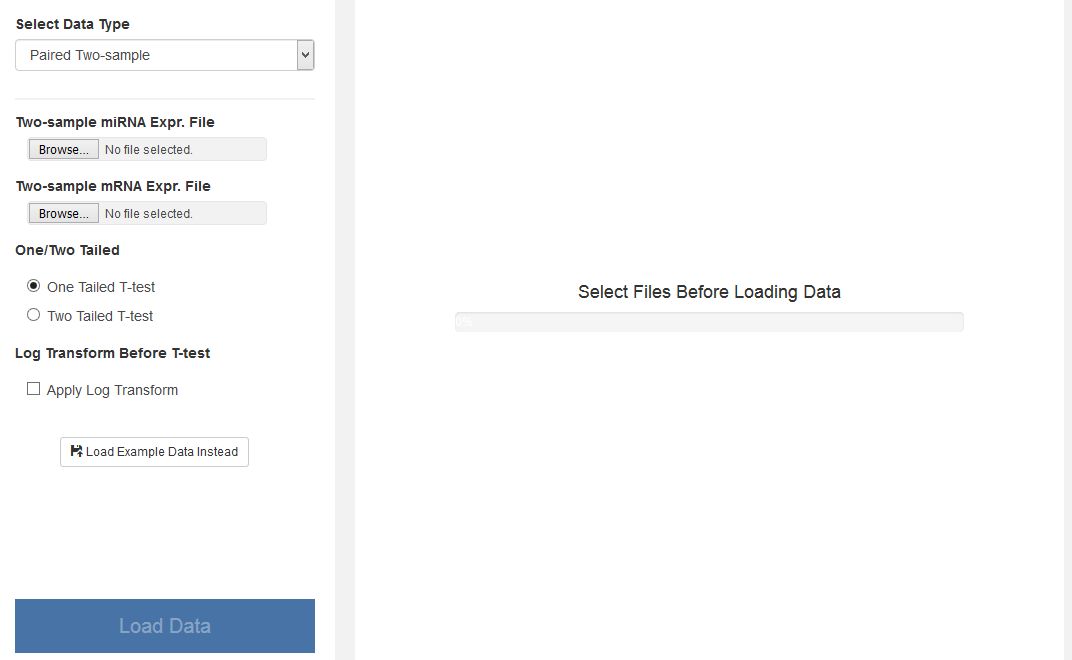 |
| Data input screen from miRTarVis+. Here you can upload your expression data for mRNAs and miRNAs and select to perform tailed T-tests to the dataset. |
Download the data files "gene_expression_mirtarvis.csv" and "miRNA_expression_mirtarvis.csv" and store in a local folder of your computer. In the data input screen of miRTarVis+ select the following options:
1.- Select data type: "Unpaired Two-sample"
2.- Two-sample miRNA Expr. File: upload the "miRNA_expression_mirtarvis.csv" file
3.- Two sample mRNA Expr. File: upload the ""gene_expression_mirtarvis.csv" file
4.- One/Two tailed: select "Two tailed T-test"
5.- Log transform before T-test: left it unselected
Now click the down button "Load Data". After uploading the data, the software will analyze separately the miRNA and mRNA expression data, performing a T-test between samples. You will see a screen like that with the results:
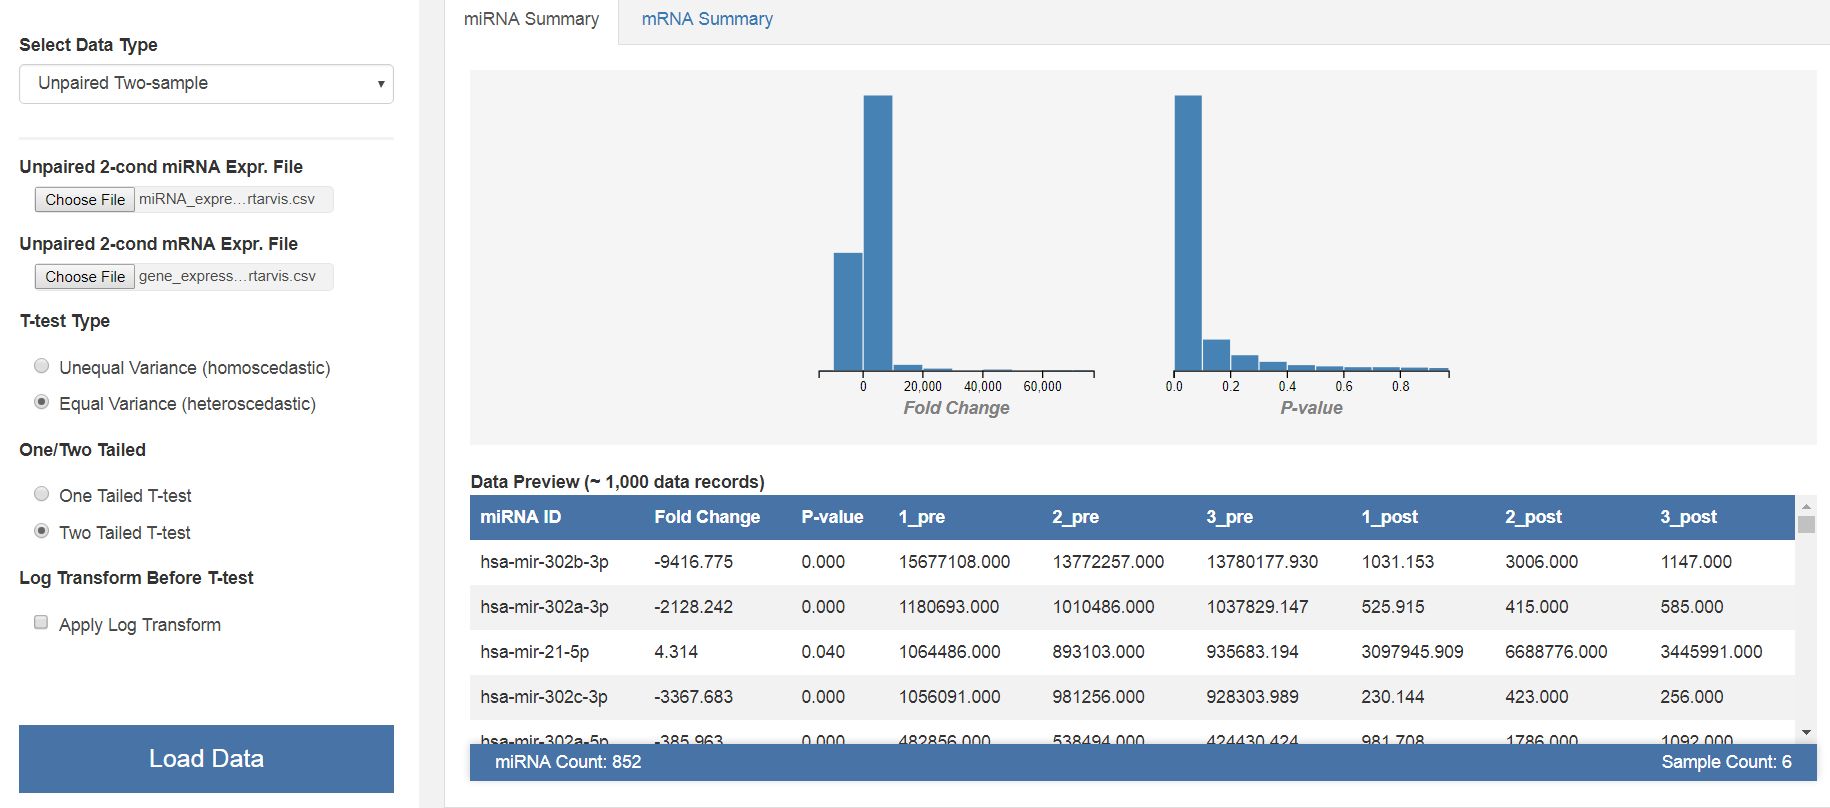 |
| Results of the initial T-test analysis of miRNA and mRNA expression data. The software allows to visualize the results of the miRNA and mRNA analysis in a graphical and tabular format. |
3.- Data filtering and correlation analysis
miRTarVis+ has an upper navigation bar that allows the user to switch between analysis steps. Now, we need to filter the results to include only the relevant data. So, in the upper bar select "FILTER":
For the miRNA and mRNA expression we will exclude data with a p-value>0.05. For the expression values, in the case of miRNAs we will filter data with expression levels below 1.5 fold change between samples, and for the mRNAs we will exclude those data points with fold changes less than 3. Please, introduce those values, and click the down button "FILTER DATA".
Now we will perform a correlation analysis selecting the section "PREDICT" in the upper bar. For the correlation analysis there are many available methods in miRTarVis+. We will perform two of these methods: a simple correlation analysis and a more sophisticated one called MINE, that contains more powerful algorithms to predict targets. The subjacent idea of the method is very simple; the software will predict targets for the selected miRNAs and will analyze if the expression levels of these targets are or not correlated with the cognate miRNA. Of course that we are looking for inverse correlations between miRNAs and their targets. To simplify the analysis, we will just look to the up-regulated miRNAs and their targets (expected to be down-regulated).
In the "PREDICT" section, select the "Correlation analysis". In this screen introduce the following data:
1.- Top N interactions: 70
2.- Start with: we will select the TargetScan prediction algorithm
3.-Cutoff: let if by default in 0.5
4.- Correlation type: select "Pearson correlation"
5.- Negative correlation: tick to select "Only negative correlation"
6.- Change direction: select the option "Up miR-Down gene"
Then click the lower button "Predict". You will see something like that:
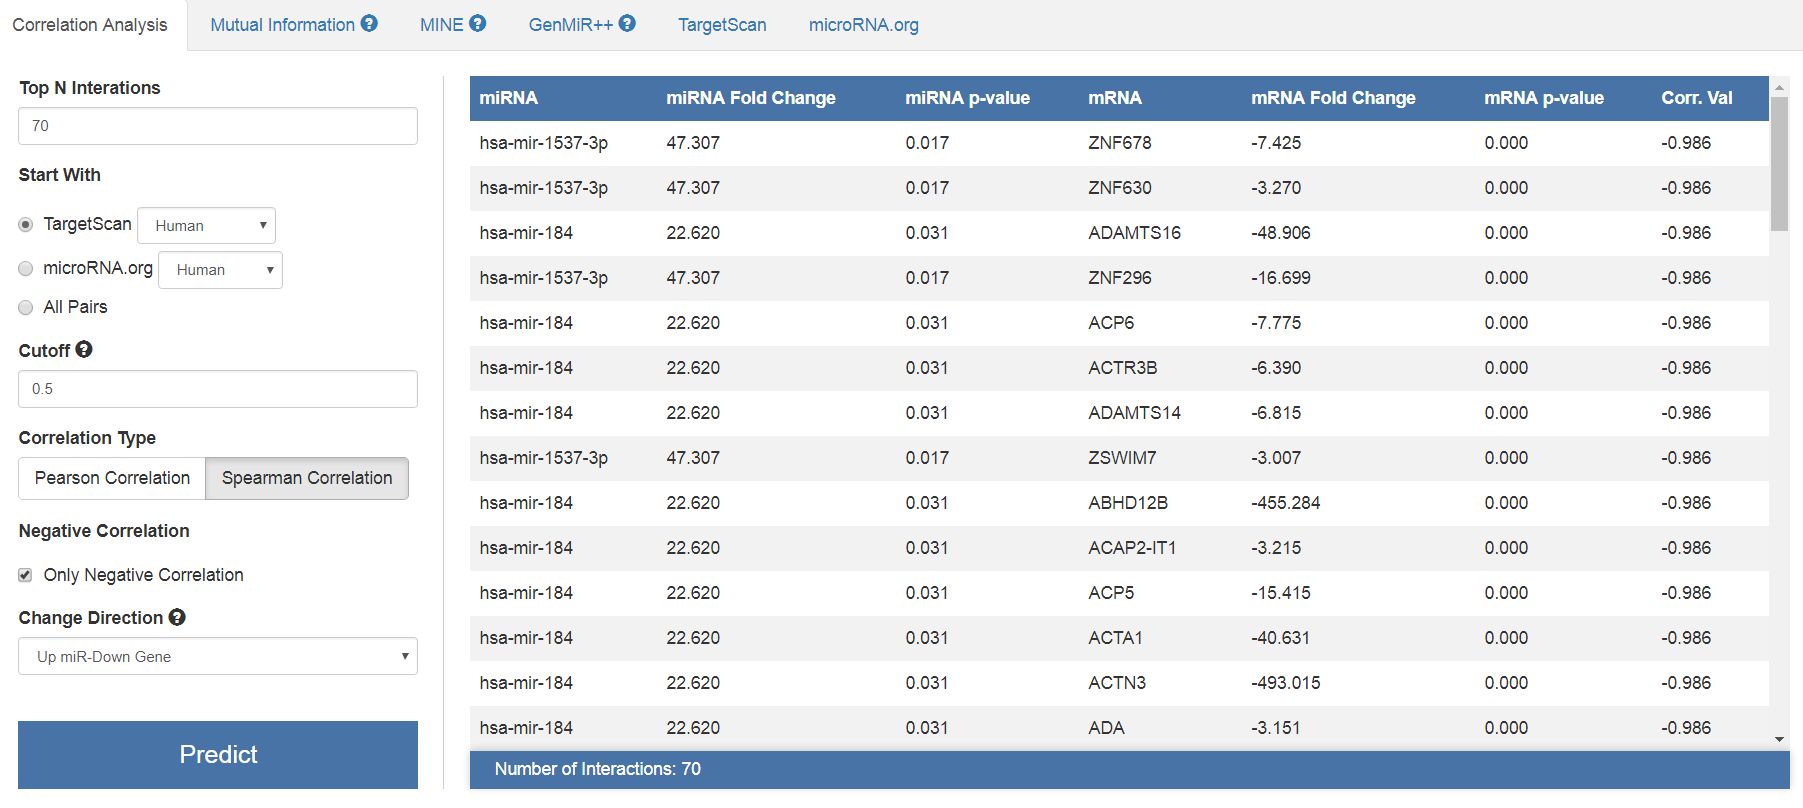 |
| Results of the correlation analysis with miRTarVis+. You can see the tabular data containing the relationships between miRNAs and their targets, together with a correlation coefficient. |
In the same way, we will perform a correlation analysis with the MINE algorithm. This is a bi-clustering algorithm, pretty much powerful than the classical correlation analysis. You can use other analysis as GenMiR++ employing the same strategy. For MINE analysis, consider the first 70 interactions, the TargetScan prediction algorithm and the direction change of "Up miR-Down Gene". After clicking "Predict" you will see something like that:
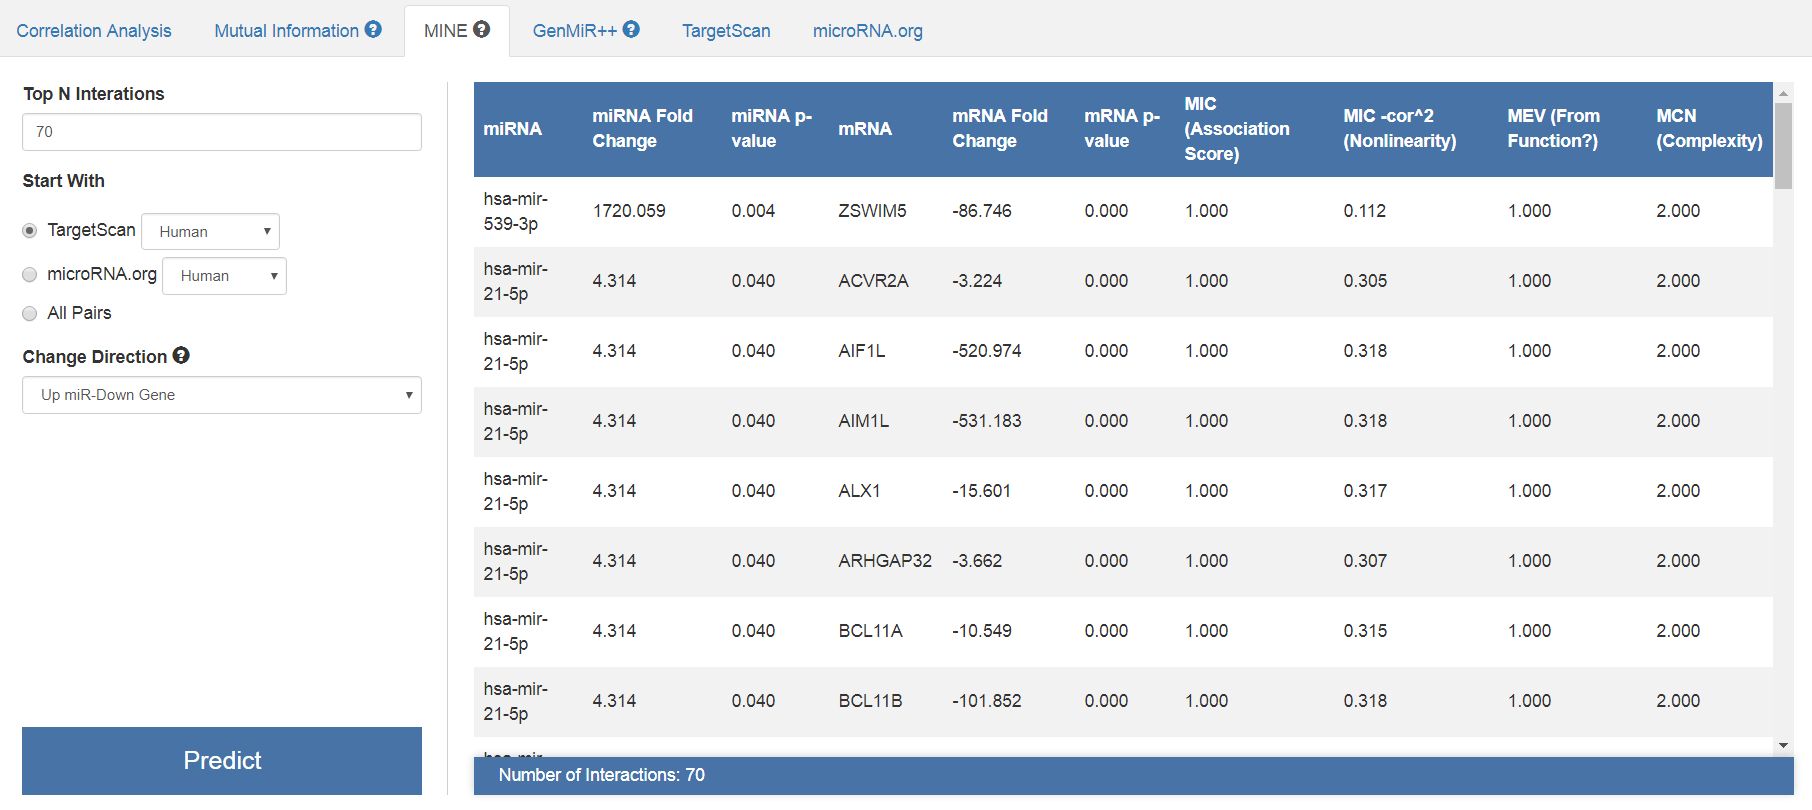 |
| Results of the correlation and bi-clustering analysis by MINE algorithm. Note that the significance scores are not only the correlation coefficients, but also the complexity scores and the association scores. |
4.- Graphical analysis of the results
miRTarVis+ has a powerful graphical interface that allows an interactive representation of the relationships betweeen miRNAs and their targets, together with the expression levels. For getting a graphical representation of the results, click in the "VISUALIZE" section of the upper navigation bar. You have two tastes of graphical representation: node link diagram and treemap. This is how will look like the "Node link diagram" of our data after all the analysis:
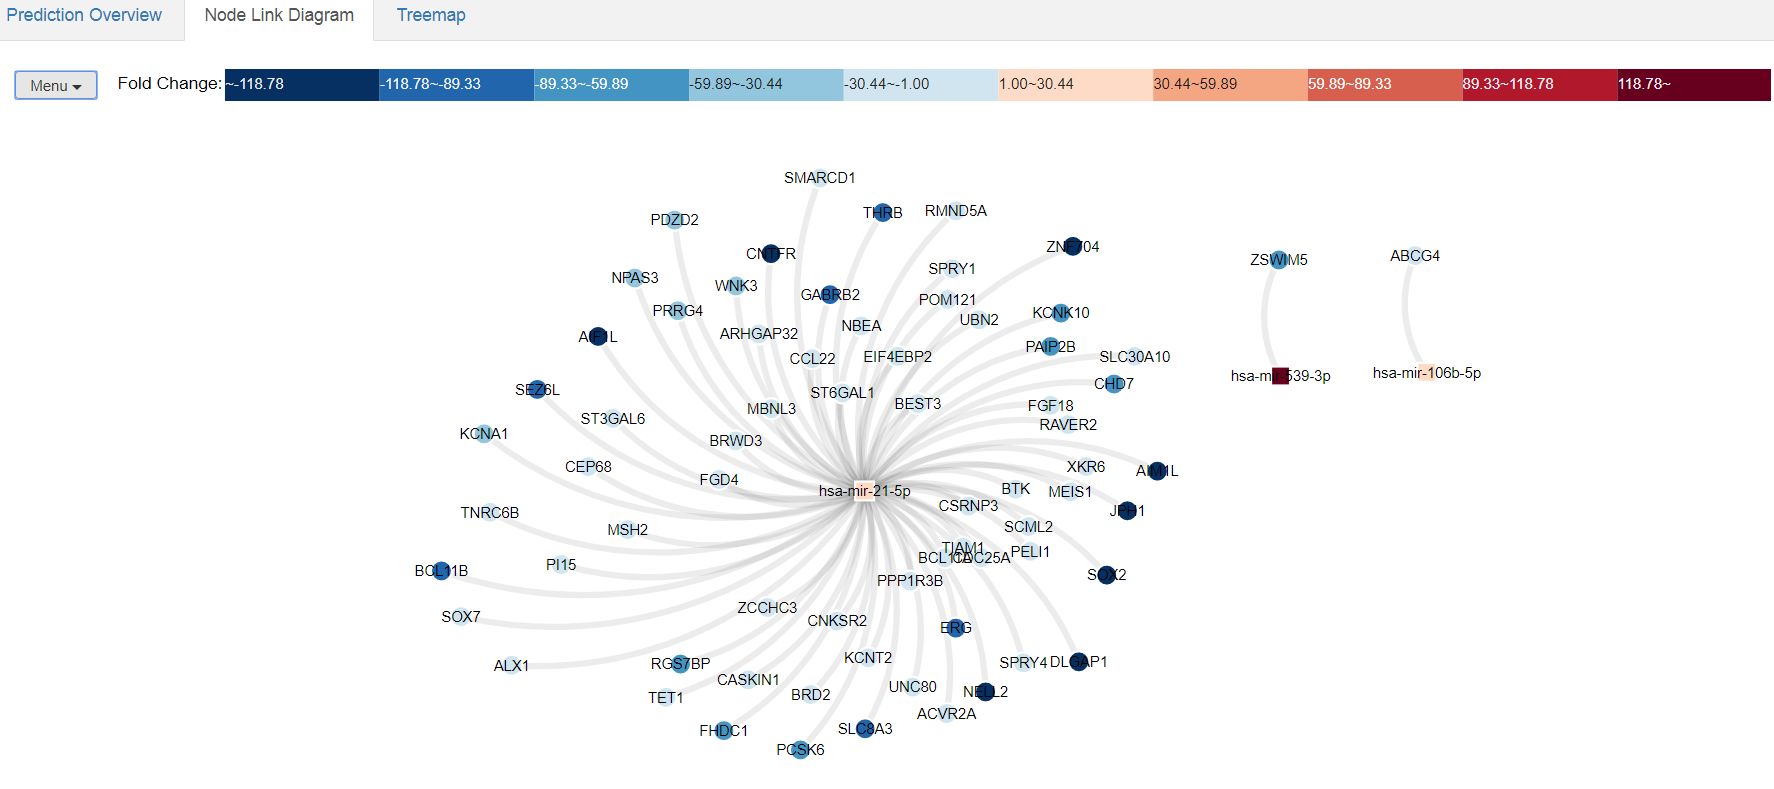 |
| Node link diagram of the processed data. Here you can visualize the miRNA-target relationships together with the relative expression levels of each gene. In the upper scale you have a color-coded representation of the expression levels. This diagram is totally interactive, and you can get information about the expression levels of each gene or miRNA by just pointing with the mouse over it. In the upper hand-side the "Menu" tab allows the user to change the visualization options of the diagram. |
And this is the aspect of the treemap representation of the results:
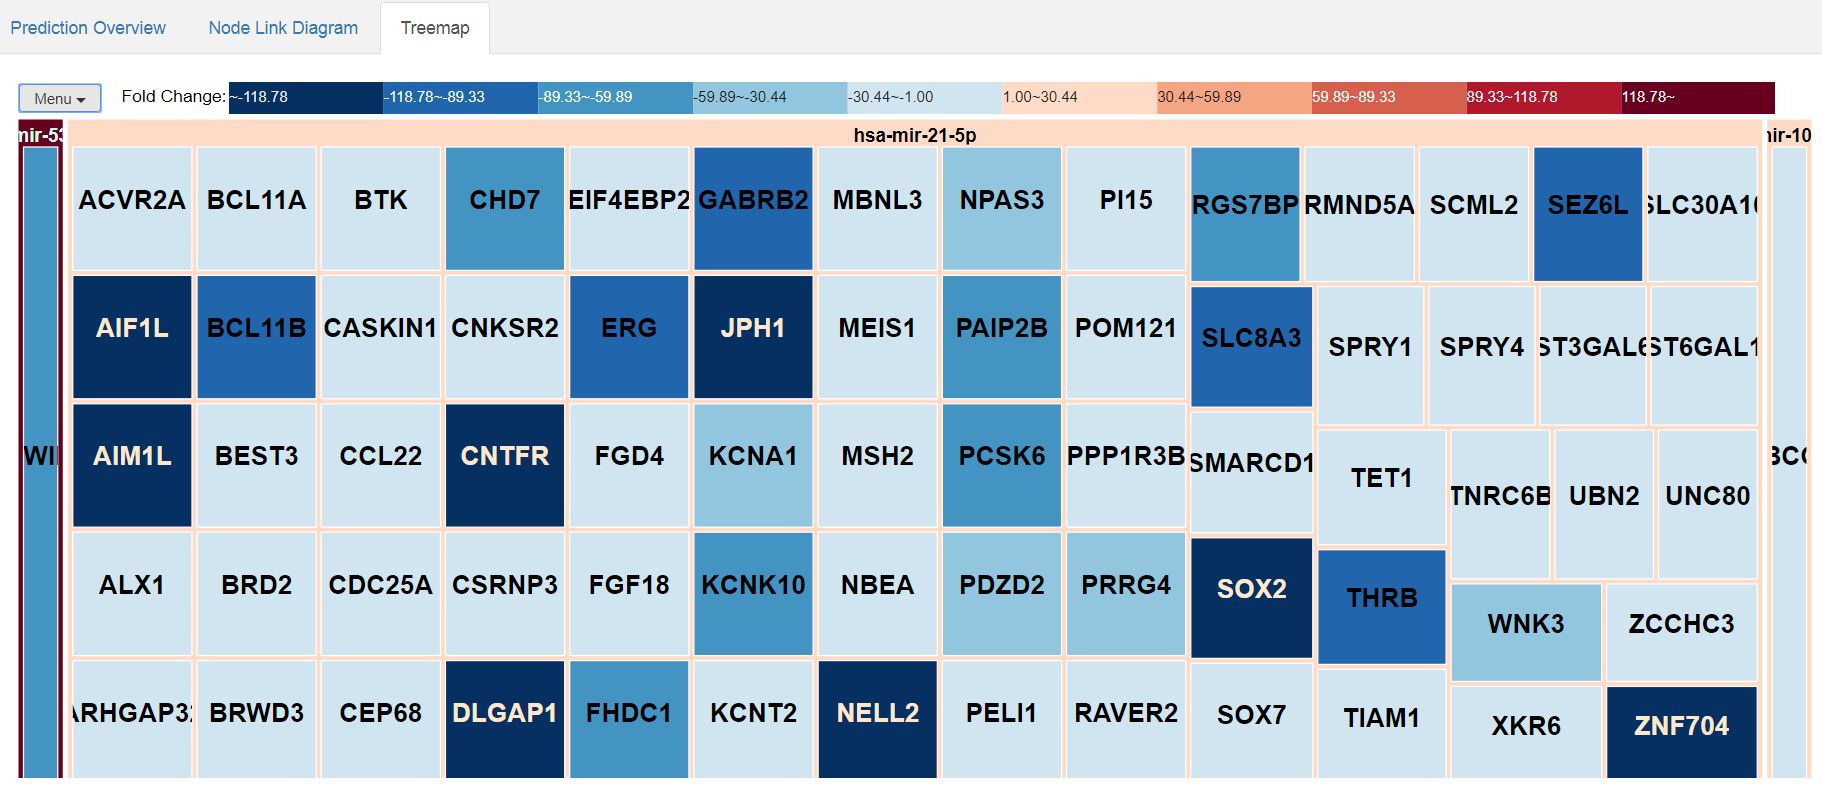 |
| Treemap representation of the relationships between miRNAs and their targets, together with the relative expression levels. |
Now you can play with different parameters of the analysis, for instance increasing the number of relevant interactions represented. Be careful, since a higher number of relevant miRNA-mRNA interactions could be very difficult to interpret, specially in the graphical representation. For the most "advanced" users, you can think about overlying more information in the interaction network, for instance interaction between coding proteins that can be retrieved from STRING database.
For the study of more complex relationships between miRNAs and targets, other application such as MAGIA2 also consider the presence of feedback loops between miRNAs and transcription factors. You can try the same kind of analysis using the example data in this application and check for the existence of these regulatory loops.
-
© Francisco J. Enguita. 2010-2017. All rights reserved.