miRNAtools3 > Tutorials > Pathway analysis
Scenario 3: Pathway analysis
![]()
1.- INTRODUCTION
Let's start with the same biological evidences already described in Scenario2 and consider the 17-92a miRNA cluster as a starting point. Remember that this cluster is composed by six miRNAs in tandem (hsa-miR-17-5p, hsa-miR-18a-5p, hsa-miR-19a-3p, hsa-miR-20a-5p, hsa-miR-19b-3p and hsa-miR-92a-3p) and that it has been involved in cell proliferation. This tutorial will try to analyze the putative pathways and biological processes in which this miRNA cluster is involved. Instead of individual targets, we will try to look to the problem using a wider approach.
2.- Pathway analysis by mirPath3
There are many web-based tools to perform this kind of analysis. For this tutorial we will use mirPath3, a part of the DIANA suite. This web-tool shows an excellent performance in this kind of analysis, but its web interface is not very intuitive and easy to use. Open the mirPath3 web page, and you will see something like that:
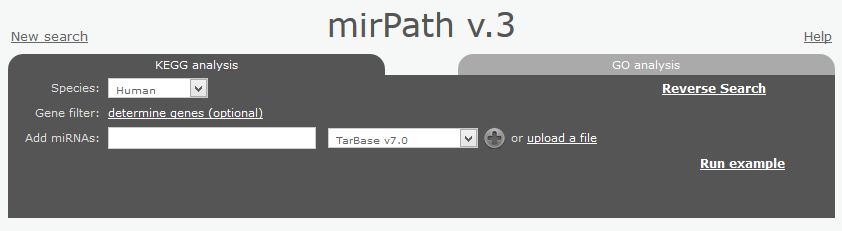 |
| mirPath3 input page. In order to feed the application you need to introduce miRNAs names one by one or upload them in a text file. You have two sections "KEGG analysis" and "GO analysis" to perform pathway or GO-enrichment analysis respectively. |
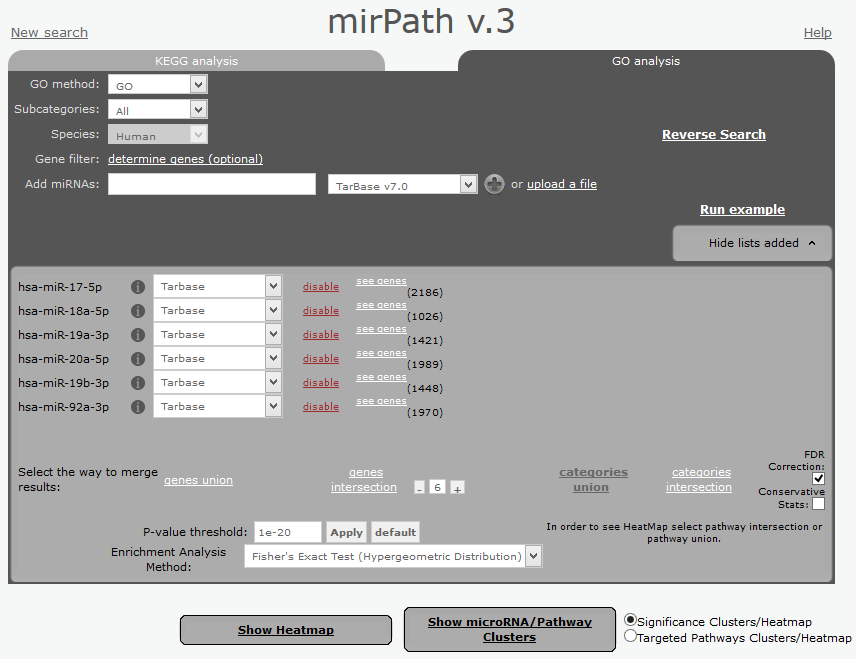
To introduce data, insert the names of the 17-92a cluster elements and click "+" to add them sequentially. Select Tarbase v7.0 to perform a KEGG pathway analysis using this database of validated targets. You can also do the same kind of analysis by using target-prediction algorithms by selecting in the corresponding option (available algorithms are DIANA and TargetScan). When introduced all the names of the six miRNAs, you must see something like that in your window:
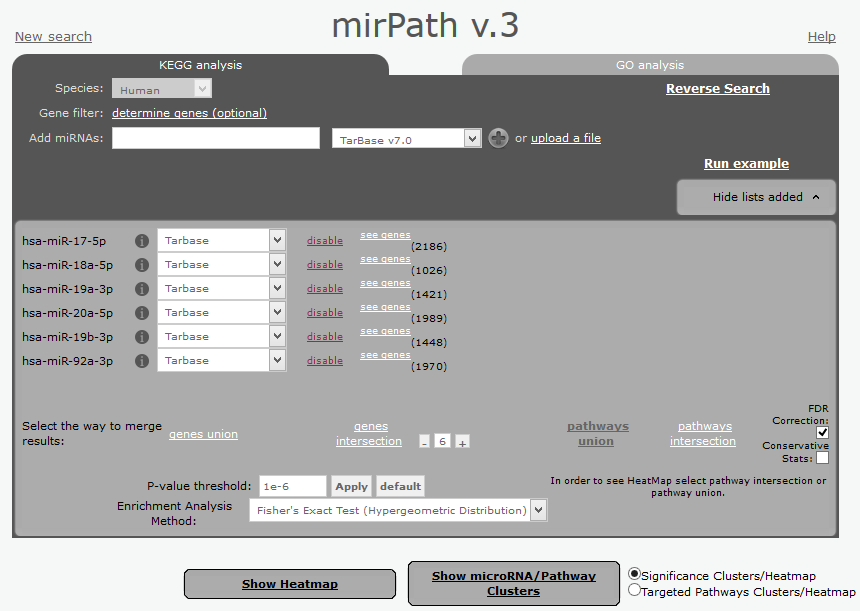 |
| Input window for mirPath3 after the introduction of our data. Once introduced, every miRNA will appear in one single line indicating the number of targeting genes within the target database. Let all the options by default, but modify the P-value thresold to the showed value (1e-6) and click "Apply" to perform a stringent analysis and avoid noisy results. |
In order to show the results of the pathway analysis, select the option "pathways union". This will allow to determine all the biological pathways where those miRNAs are involved. After the selection you will get a table of results that will look like below.
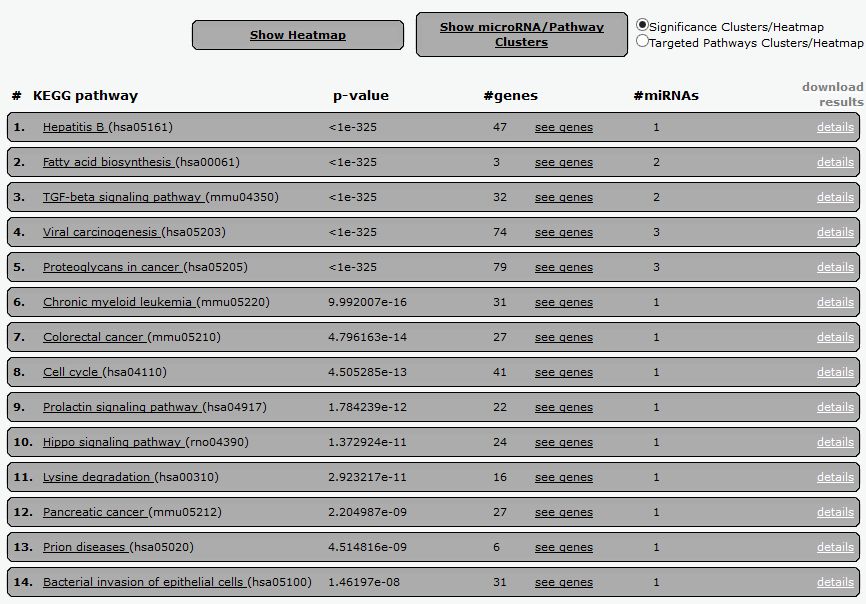 |
| Tabular results of the pathway analysis using the members of the 17-92a cluster, and the already described parameters. In every line you will see the name of the corresponding KEGG pathway, the p-value, number of genes and miRNAs involved. Please be aware that the p-value is determined not only by the number of miRNAs targeting this particular pathway, but also by the relative position of the gene within the pathway. So you will get a better p-value when the targeted gene is more upstream in the pathway (receptor versus effector). Results can be download and imported in Excel by clicking the "download results" option. |
Now, to see the graphical results of the analysis you can click the option "Show Heatmap" and maintaining selected the option "Significance Clusters/Heatmap" in the results screening to obtain a graphical representation of the considered pathways and the regulatory effect of every miRNA.
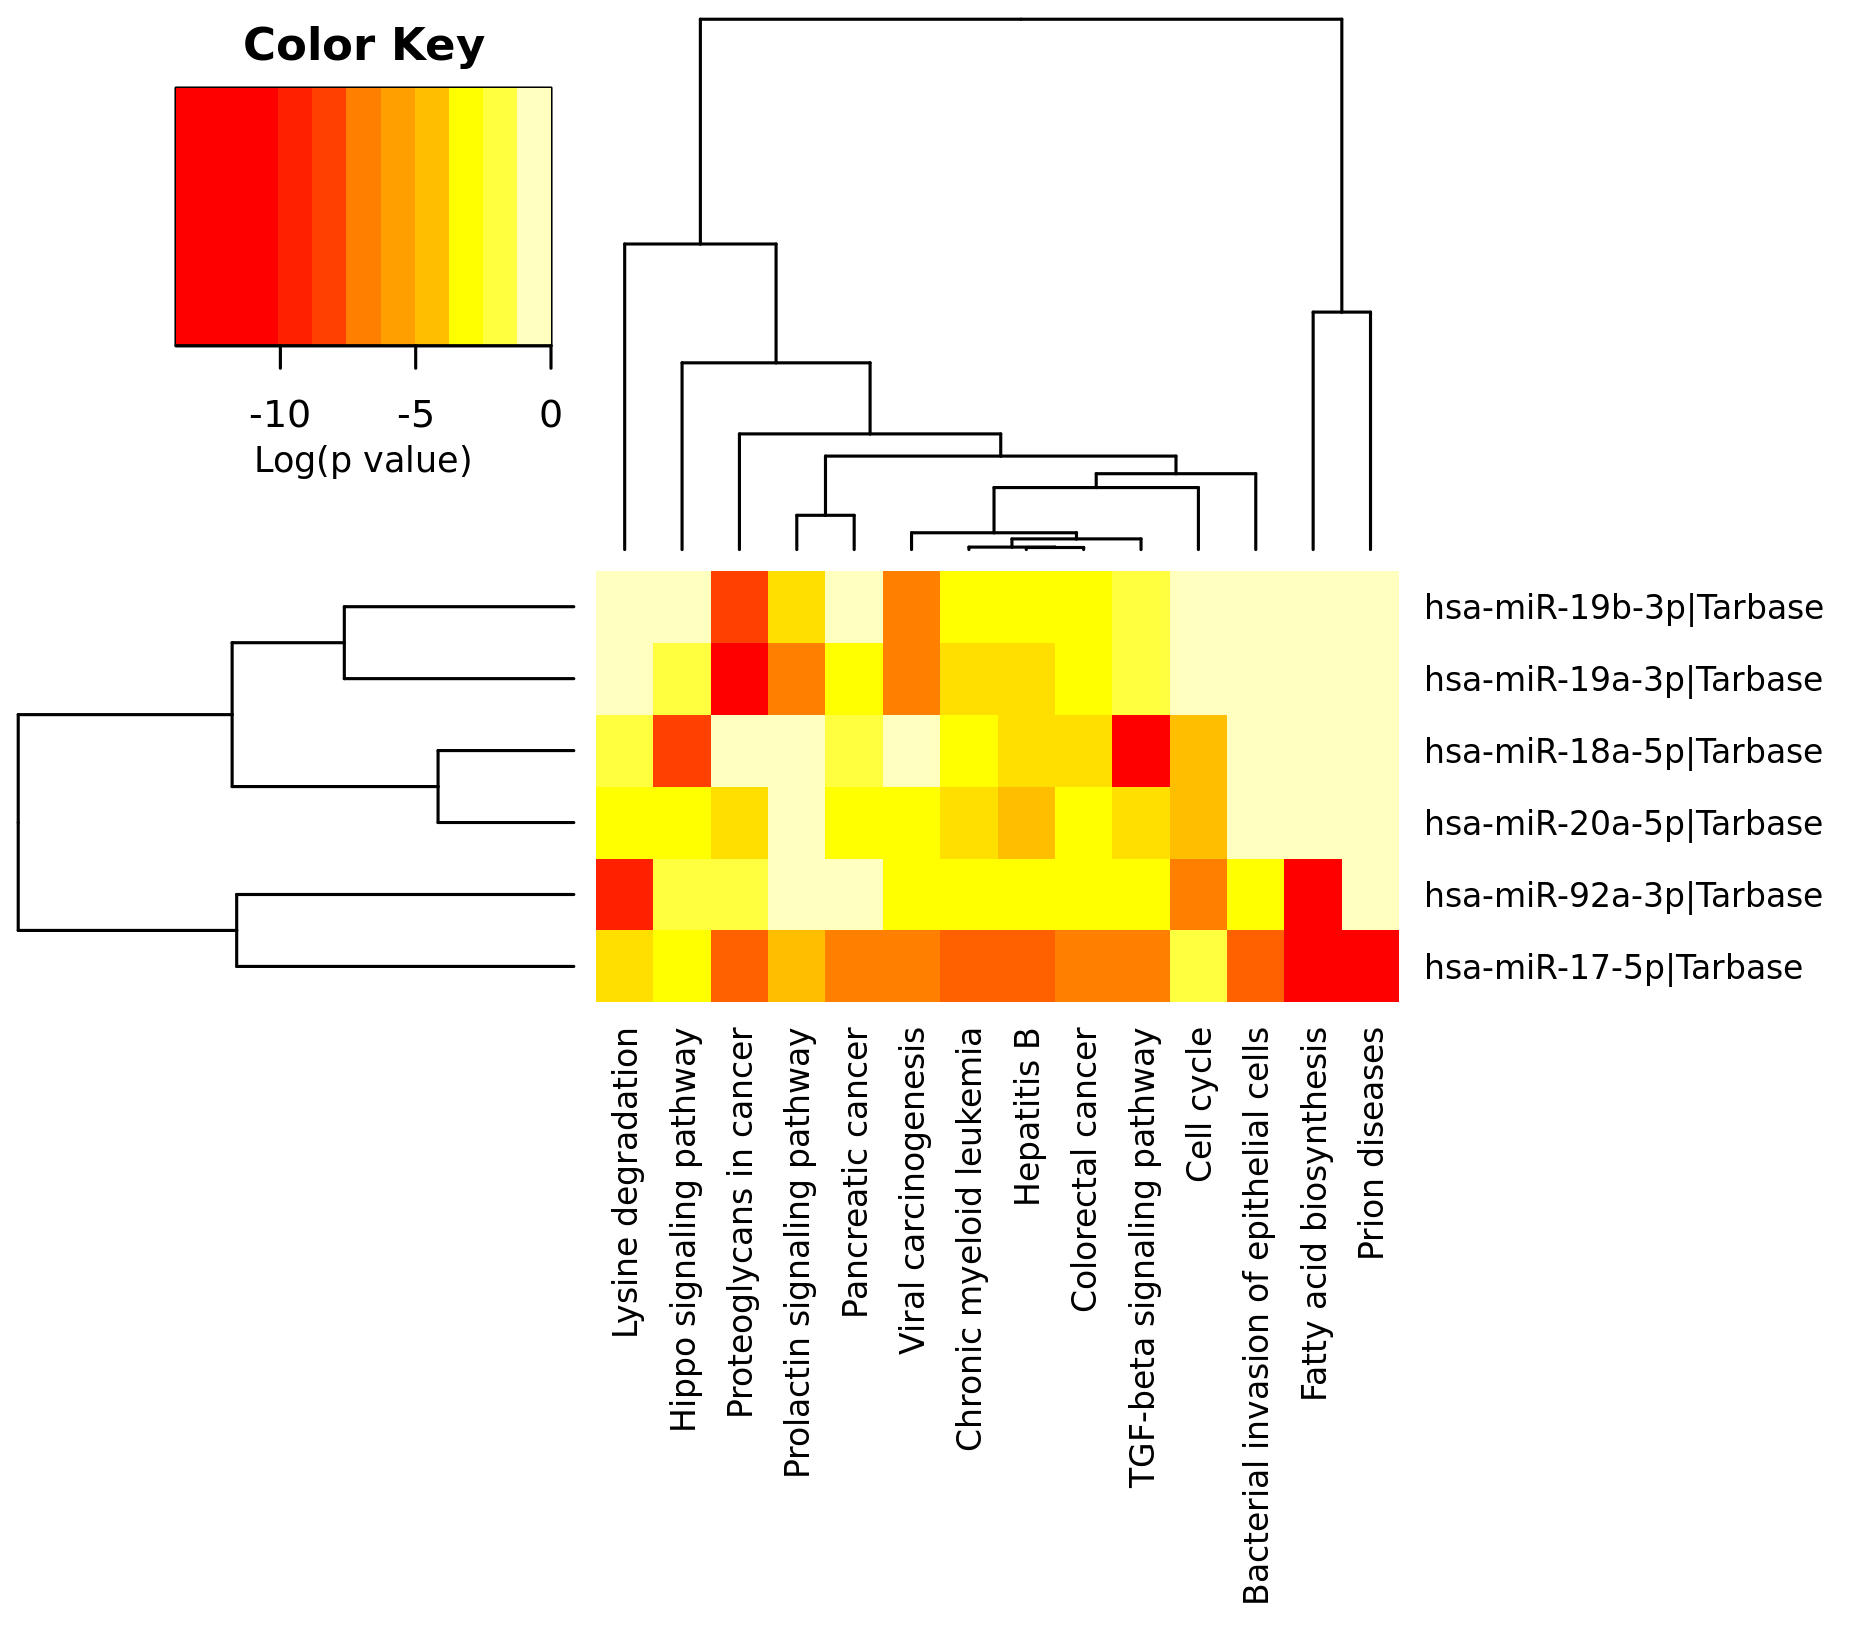 |
| Heatmap results of the pathway analysis of 17-92a cluster elements by mirPath3. In this way you can see the coordinated effects of all miRNAs over a particular path (quantitifed as p-value). |
Clicking the name of a particular pathway in the tabular results you will get directly to KEGG website, getting a graphical representation of the pathway with the hightlighted genes regulated by the considered miRNAs.
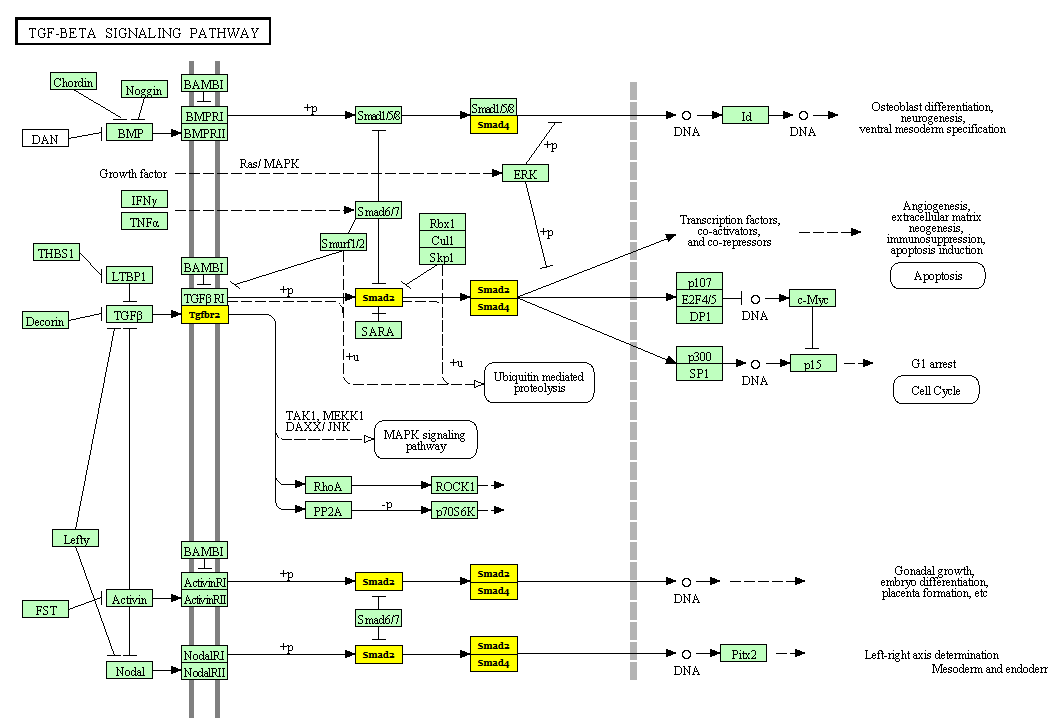 |
| TGF signalling pathway (KEGG database). The "yellow" hightlighted genes are those regulated by some of the analyzed miRNAs. |
3.- GO-term analysis with mirPath3
The same web-tool can be used to perform a GO-term enrichment analysis. We will follow the same approach, but selecting the "GO analysis" option in the data input screen. Please be careful to decrease the p-value thresold to 1e-20 to eliminate non-relevant output. This is required in GO-term analysis since the results are tipically more noisy.
 |
| Input screen for GO-term enrichment analysis. Note that you need to reduce the thresold of the P-value to 1e-20 and click "Apply" to activate the analysis. |
Now we can see the corresponding tabular and graphical results as already described for Pathway analysis. Below you will see the corresponding screen-shots for the tabular and heatmap results.
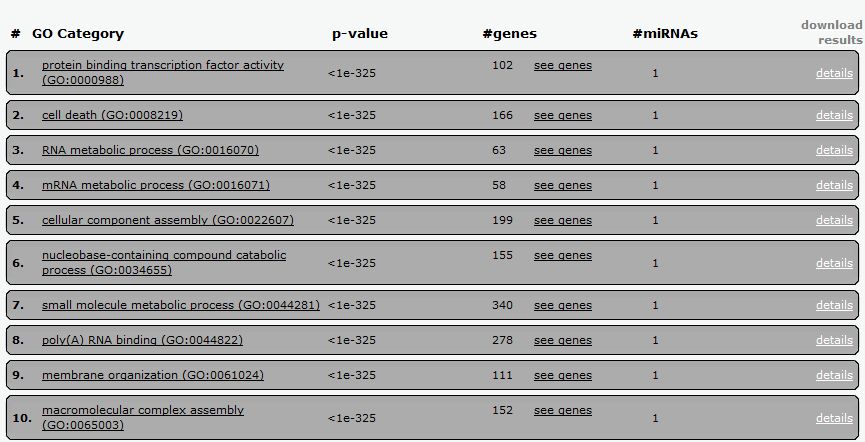 |
| Tabular results of the GO-term enrichment analysis using the members of the 17-92a cluster, and the already described parameters. In every line you will see the name of the corresponding GO term, the p-value, number of genes and miRNAs involved. Results can be download and imported in Excel by clicking the "download results" option. |
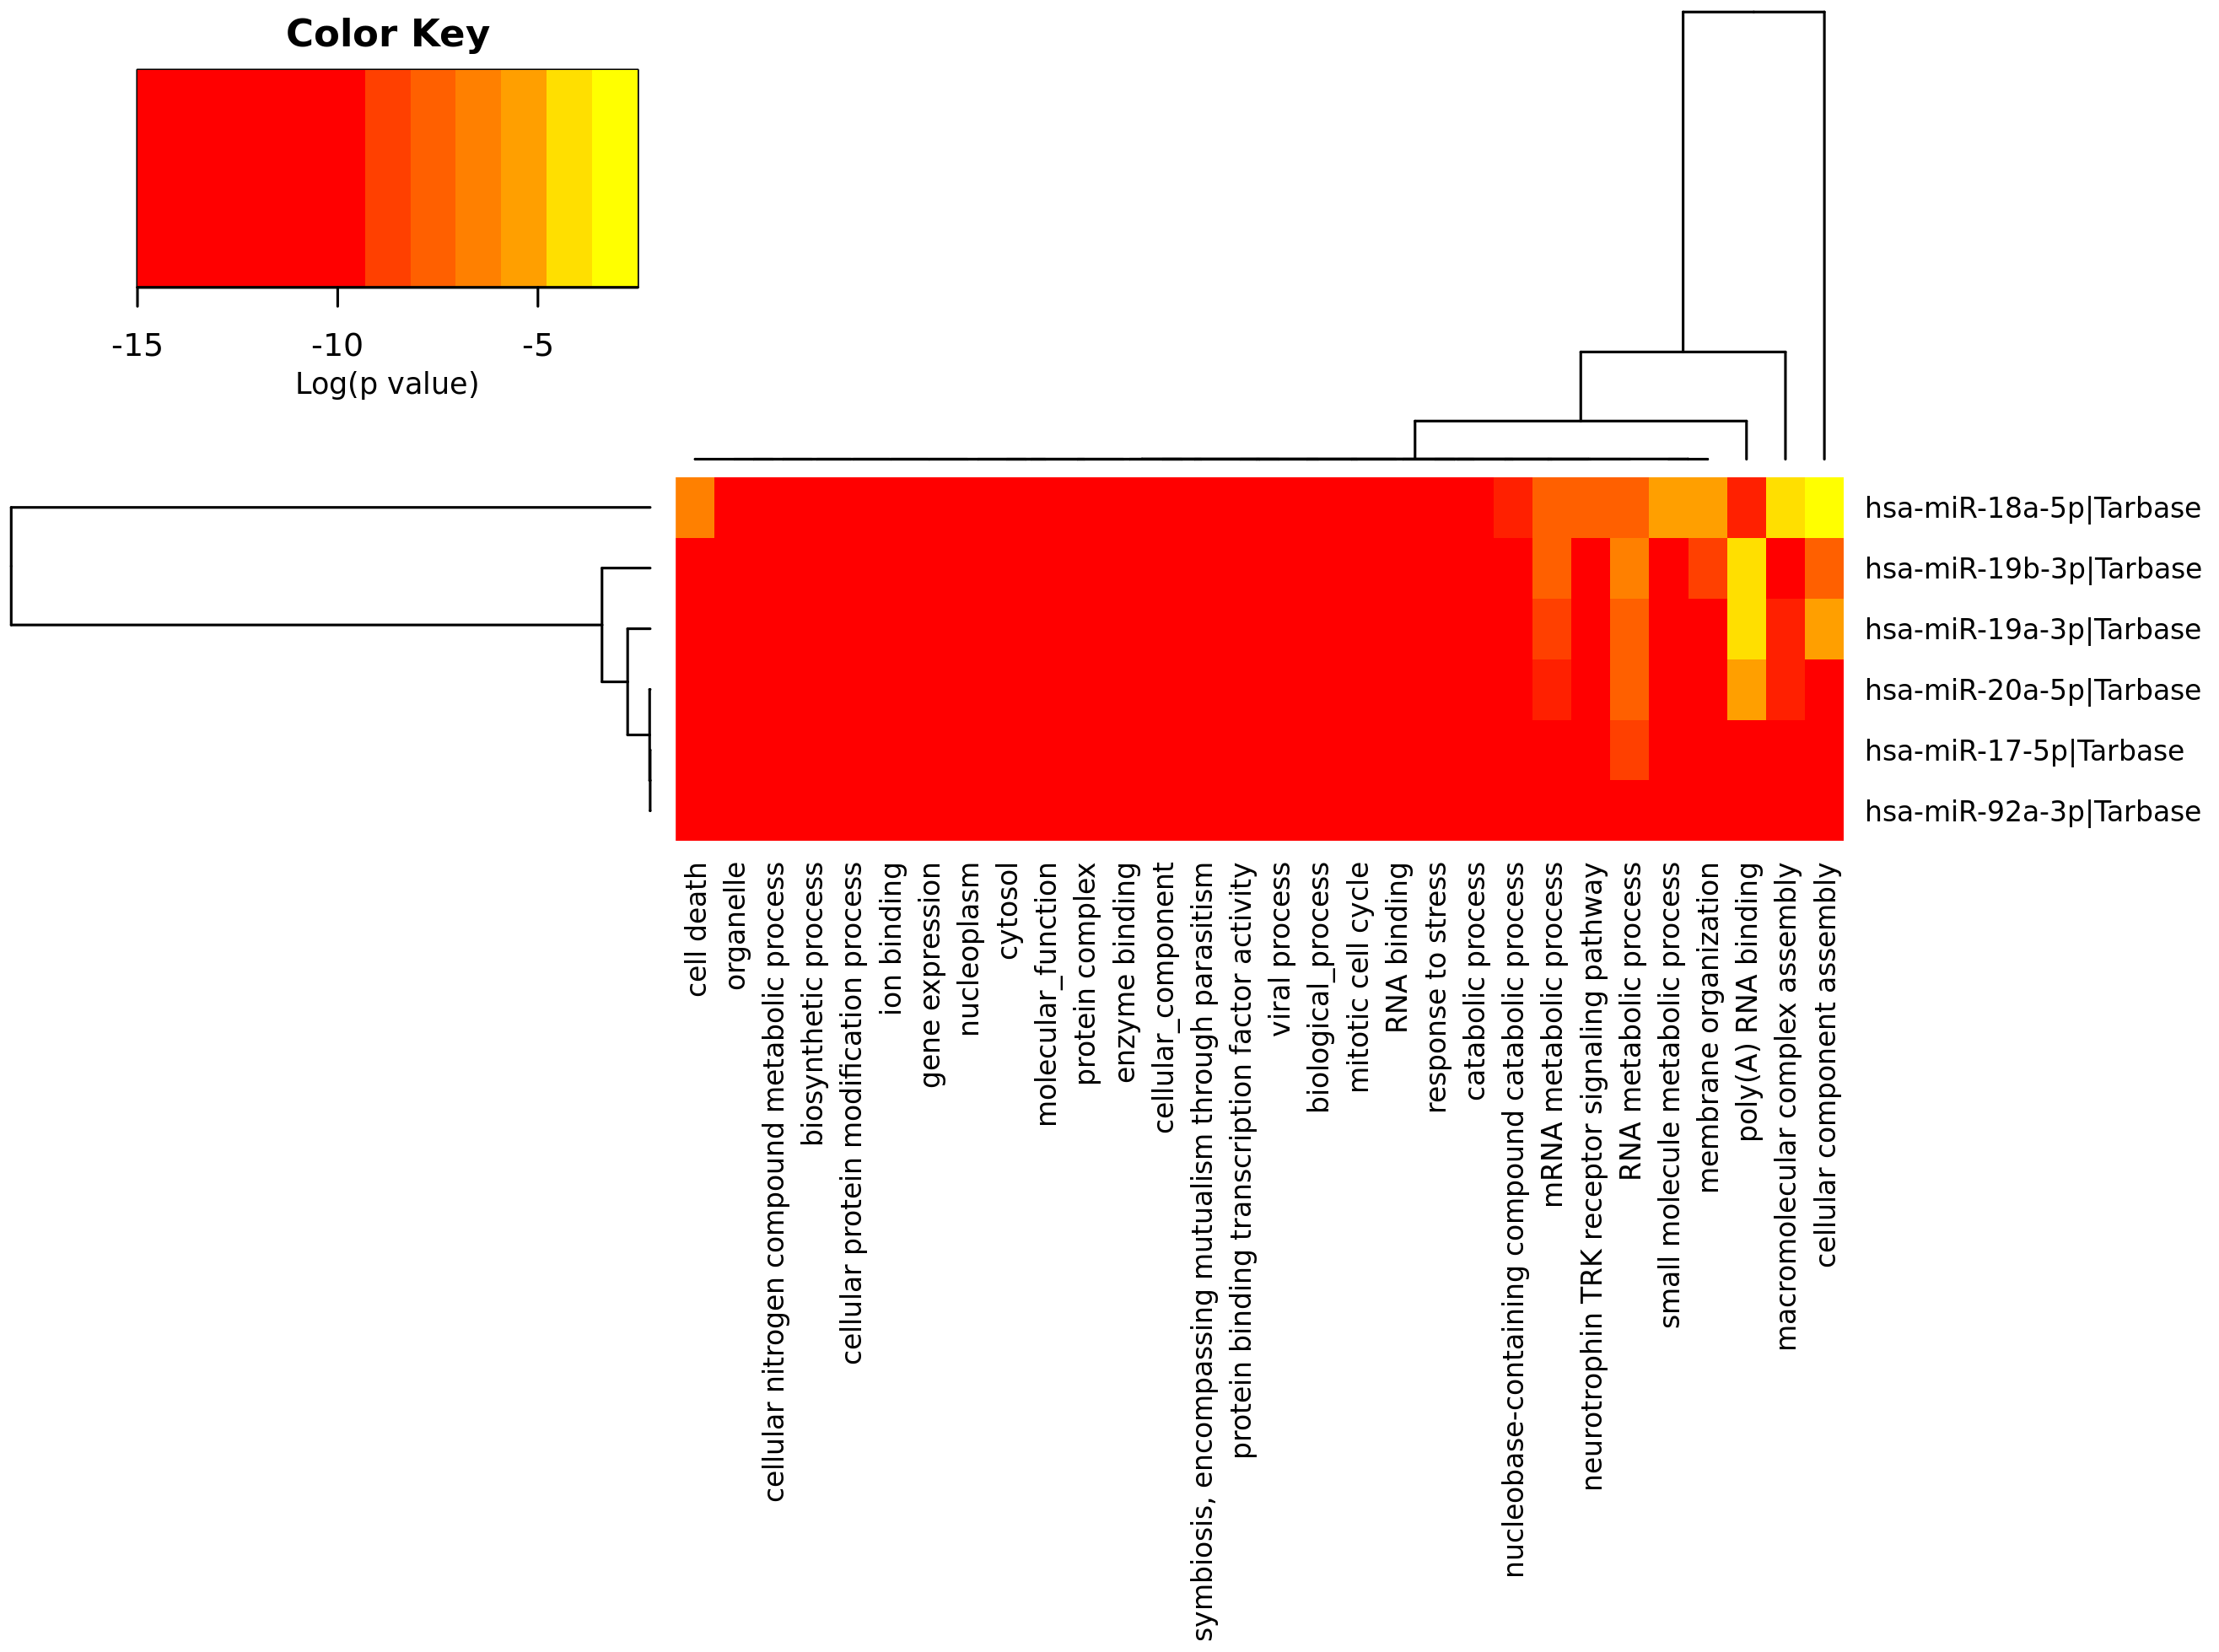 |
| Heatmap results of the GO-term enrichment analysis of 17-92a cluster elements by mirPath3. In this way you can see the coordinated contribution of all miRNAs to the list of GO-terms (quantitifed as p-value). |
-
© Francisco J. Enguita. 2010-2017. All rights reserved.